Analytics & Reporting
Measure business impact with LMS reporting
Track learner progress and measure the impact of training programs with LMS reporting tools that provide valuable insights beyond course completion rates.
Award-Winning Workplace Learning

2026 Lighthouse Tech Award – Best Frontline Focused Solution

2026 Lighthouse Tech Award – Best Advance in Practical AI

2026 Capterra Shortlist Learning Management System

2026 Software Advice Front Runners Learning Management System

ISG Research Buyers Guide Leader Overall Learning Management Systems
![]()
Solution
Automate essential LMS reports
Move on from disjointed platforms that do not seamlessly “communicate”. Instead, deploy all-in-one LMS reporting that produces useful insights and data you can correlate with KPIs.
- Get full visibility into learner progress, completion rates, and more
- Choose from hundreds of pre-built report templates or build your own
- View at-a-glance LMS reporting information through various dashboards
- Schedule reports for key training metrics or pull data in real-time
- Consult LMS reports to adjust training programs for better results
- Import KPI data via CSV or integrate with any third-party system


![]()
Reports
On-demand LMS reporting
Quickly create reports in just a few clicks. Schoox enables administrators and managers with hundreds of pre-built reports and templates for quick insights into training programs.
- Course and curricula reports by learner with status information
- Training course reports for both in-person and online sessions
- Enrollment and completion reports by learner, course, business unit, etc.
- Exams and assessments reports for test scores and skills attainment
- Due date and exception reports to identify missed mandatory training
- Duration reports to determine how much time online training takes
Dashboards
At-a-glance dashboards
View information at-a-glance with dedicated dashboards. Schoox dashboards are the fastest way for administrators and managers to understand organizational performance.
- Employee dashboards for training performance data by individual
- Course, curricula, and events dashboards with detailed statistics
- Job training dashboards for on-the-job training activities
- Exam dashboards for academy-wide scores and the option to drill down
- Dashboards to compare multiple business units and groups
- Careers dashboards to view jobs, employees in each, and skill strength


![]()
Compliance
Compliance training reports
Track compliance training with dedicated reports and dashboards that enable administrators to quickly access company-wide data about mandatory training.
- Gain insight into overall compliance scores across the academy
- See enrollment and completion stats for each compliance training program
- Drill into data to make informed decisions and adjust training strategy
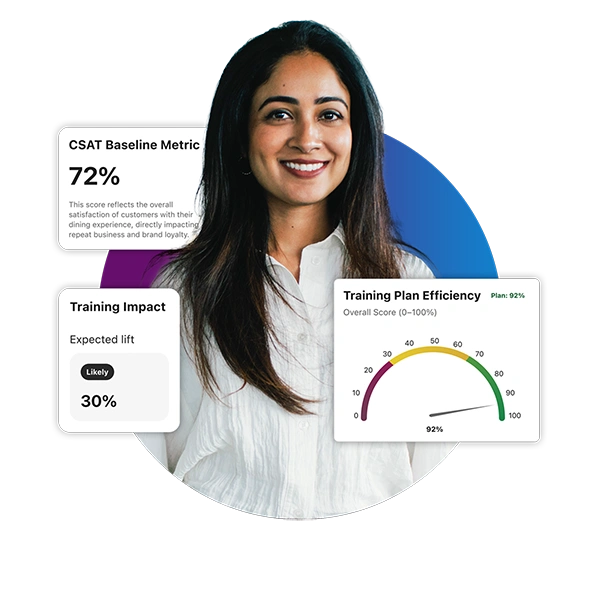
Business Impact
Business impact reporting
Measure training ROI and discover how learning impacts business outcomes with key metrics tied to organizational performance and greater visibility into actionable data.
- Easily set up KPIs by importing data or integrating with third-party apps
- Analyze KPI data to uncover training gaps and core insights
- Visualize the correlation between training initiatives and any KPI you track

Features
Take action on reporting and analytics
Leverage advanced LMS reporting features to analyze the business impact of employee training.

Business impact analysis
Take advantage of the industry’s only business impact reporting capabilities built right into the LMS.
Pre-built reports
Leverage hundreds of pre-built templates for quick and easy insights into learner data.

Custom reports
Create your own custom reports to gather critical data your way.

Dashboards
Customize your dashboards to get a comprehensive overview of learner progress.

KPIs
Define the key performance indicators (KPIs) that matter to your business and measure training ROI.

Scheduling
Automate LMS reporting to send critical data directly to the inbox of anyone who needs it.

Compliance
Track your progress and see details and statistics about compliance training overall.
Training manager reports
Empower managers with access to quick insights about individual learners and groups.

Benefits
LMS reporting features that help you make smarter decisions
Access comprehensive data and reporting tools to take your people and business to the next level.

Measure learning ROI
Go further with reporting and analytics that show the impact of training programs and help you design more relevant training based on actual data.

Gain visibility
Optimize the learning process with LMS reporting capabilities that provide visibility across different teams, brands, departments, and business units.

Protect critical data
Say goodbye to panic-inducing reporting. Organize and share corporate training data securely and determine who has access to sensitive information.

Optimize learning outcomes
Gather learner feedback and measure learning ROI to make improvements and provide a better learning experience.
LMS Reporting
Link learning to business results with Schoox
Go beyond basic training metrics to measure the business impact of learning.
“Schoox helps us make better business decisions because now we have more data.”

Featured learning analytics resources
Check out these featured resources to learn how our learning platform delivers business insight.

Frequently Asked Questions
The business impact capabilities of Schoox include both standard as well as BI-driven reporting that correlates training to key performance indicators (KPIs). You can break down and understand how training has impacted the business. For example, whether more comprehensive call center training has resulted in fewer calls, shorter time on calls, and improved customer satisfaction scores.
Not at all! Every Schoox customer has the ability to use out-of-the-box reports, build their own custom reports, and create the business impact reports that tie training to company KPIs (and it comes included in every single instance of Schoox).
The BI-driven tool can account for seasonal trends before showing data and KPI correlations, distinguish between ongoing and seasonal training initiatives, and even explore the dependency between multiple business areas, plus so much more.

Ready for Learning that Makes an Impact?
Schoox combines learning and talent development for an all-in-one platform with measurable impact.