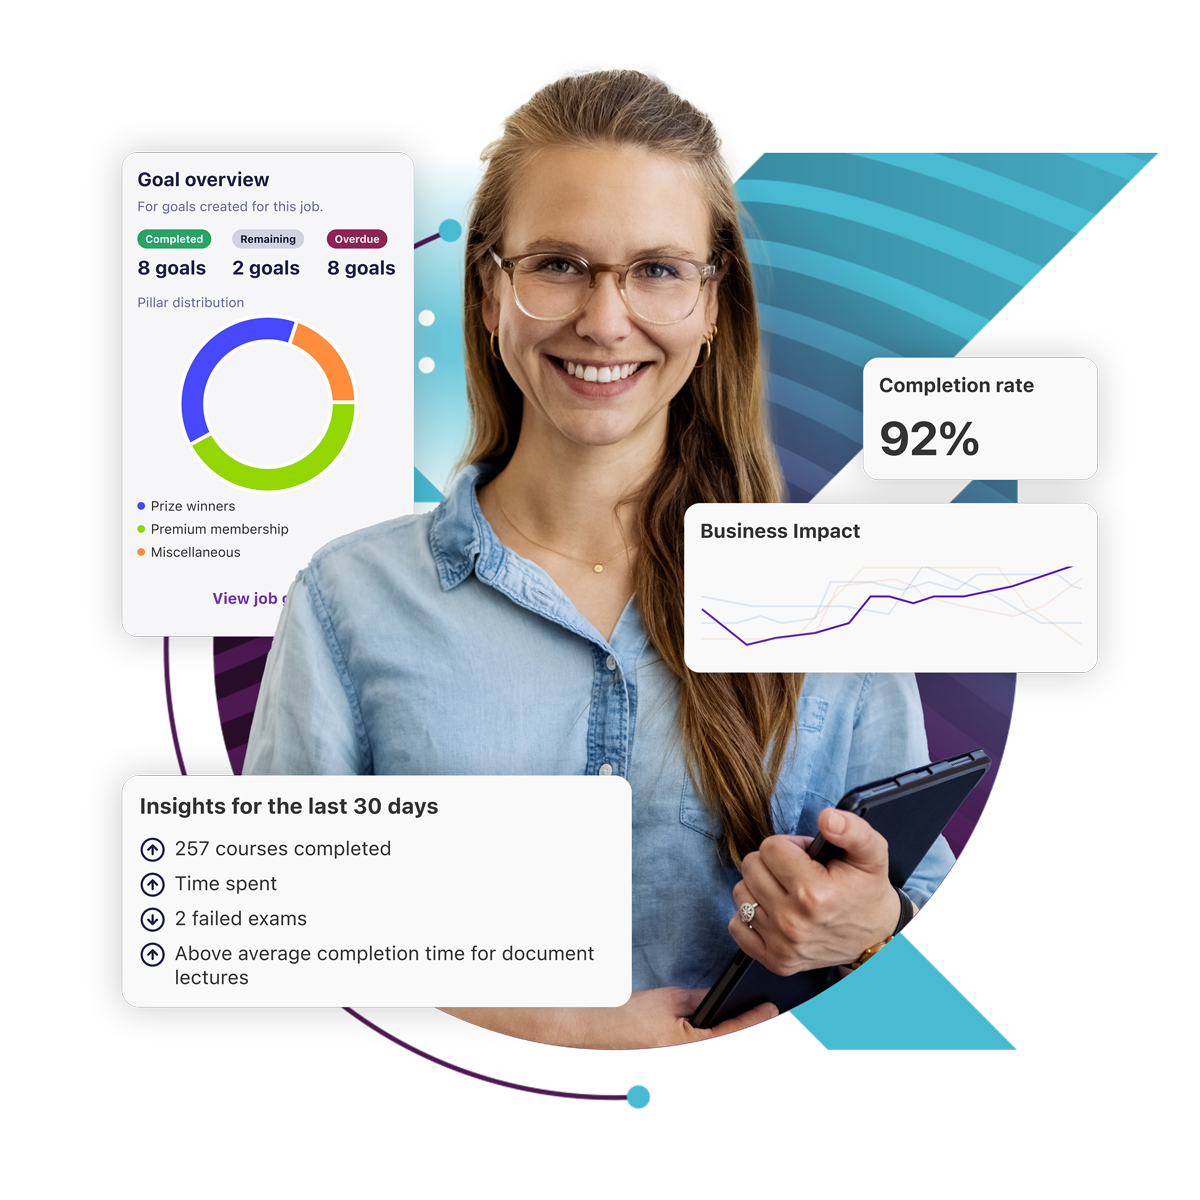
Business Impact
Measure training effectiveness with L&D impact analysis
Understand the real impact of learning and development efforts on employee performance and business success across your entire organization.
Award-Winning Workplace Learning

2026 Lighthouse Tech Award – Best Frontline Focused Solution

2026 Lighthouse Tech Award – Best Advance in Practical AI

2026 Capterra Shortlist Learning Management System

2026 Software Advice Front Runners Learning Management System

ISG Research Buyers Guide Leader Overall Learning Management Systems
![]()
Solution
See how learning affects business performance
Visualize the impact of your training programs on business objectives around sales, compliance, employee retention, and more. Explore and customize dashboards that correlate learning with the metrics that matter to your business.
- Measure how specific training programs result in tangible business outcomes
- Analyze KPI data to uncover skills gaps and training opportunities
- Use insights from L&D data to adjust business strategy


![]()
Solution
Track the KPIs that matter
Go beyond basic metrics like course completions and exam scores to more accurately track KPIs and glean valuable insights about employee growth, job performance, training costs—and how it all impacts specific business objectives.
- Easily set up KPIs by importing data or integrating with third-party apps
- See how training improves key metrics and overall business performance
- Visualize how training for new skills impacts business metrics like customer satisfaction
![]()
Solution
Share L&D insights
Easily generate sharable reports and custom dashboards featuring productivity metrics, development metrics, and detailed data about continuous learning and training programs.
- Select from hundreds of templates or build your own reports
- Schedule recurring or one-time reports to be sent to the inbox of anyone who needs them
- Set up dashboards to visualize learner progress, business impact, and performance

Features
Use key performance indicators to optimize L&D strategy
Schoox arms your L&D team with data to make smarter decisions, so you can achieve your business objectives and drive better outcomes.

Business impact analysis
Understand how your training programs move the needle on business metrics that matter, like sales.
Analytics and reporting
Leverage pre-built reporting templates, dashboards, and communication tools to share insights and data.
Custom reports
Build your own reports for specific goals, needs, and audiences with nearly limitless customizable fields.

Dashboards
View important information at-a-glance with dashboards you can personalize for each user.

KPIs
Define the key performance indicators (KPIs) that matter to your business and track progress.

Scheduling
Schedule reports to be automatically sent to the inbox of managers, executives, and other stakeholders.

Compliance
Track learner progress on compliance training and see details about completion rates, post-training assessments, and more.
Manager tools
Empower managers to lead their teams more effectively with quick access to insights about performance.

Benefits
Design learning initiatives that achieve business outcomes
Schoox is an all-in-one learning platform that includes everything businesses need to deliver continuous learning programs, positively impact employee engagement, and improve business performance. We help you take your people’s skills—and your business—to the next level.

Show the value of ongoing learning
Discover, evaluate, and monitor insights that demonstrate how learning affects critical areas of your business—like sales and safety—and adjust training based on real results.

Gain visibility
Establish clear visibility into all training activities across your entire organization, including multiple brands, business units, or departments.

Share meaningful L&D data
Securely organize and share data that clearly shows how learning affects business goals with anyone inside or outside your organization.

Adjust learning programs
Get the most out of your learning and development programs with quick and easy access to learning data that enables you to optimize training based on actionable insights.
“As we have grown, so have the demands for an advanced learning management system. We chose Schoox to enhance how learners experience our brands and provide the robust learning and comprehensive reporting we need to support our plans for growth.”

Featured business impact resources from Schoox
Check out these featured resources to learn how our learning platform drives business growth.

Frequently Asked Questions
The business impact capabilities of Schoox include both standard as well as BI-driven reporting that correlates training to key performance indicators (KPIs). You can break down and understand how training has impacted the business. For example, whether more comprehensive call center training has resulted in fewer calls, shorter time on calls, and improved customer satisfaction scores.
Not at all! Every Schoox customer has the ability to use out-of-the-box reports, build their own custom reports, and create the business impact reports that tie training to company KPIs (and it comes included in every single instance of Schoox).
The BI-driven tool can account for seasonal trends before showing data and KPI correlations, distinguish between ongoing and seasonal training initiatives, and even explore the dependency between multiple business areas, plus so much more.

Ready for Learning that Makes an Impact?
Schoox combines learning and talent development for an all-in-one platform with measurable impact.